
How to: Change chart type of a custom report
You can change the type of chart displayed in a report: First, select the graph you want to change, then click on the settings button, and click on Run designer: Then click on the “Change type” button: Choose the new type: Click on OK, and look at the modifications applied: You also can, in this form, customize graph content (title,…
You can change the type of chart displayed in a report:
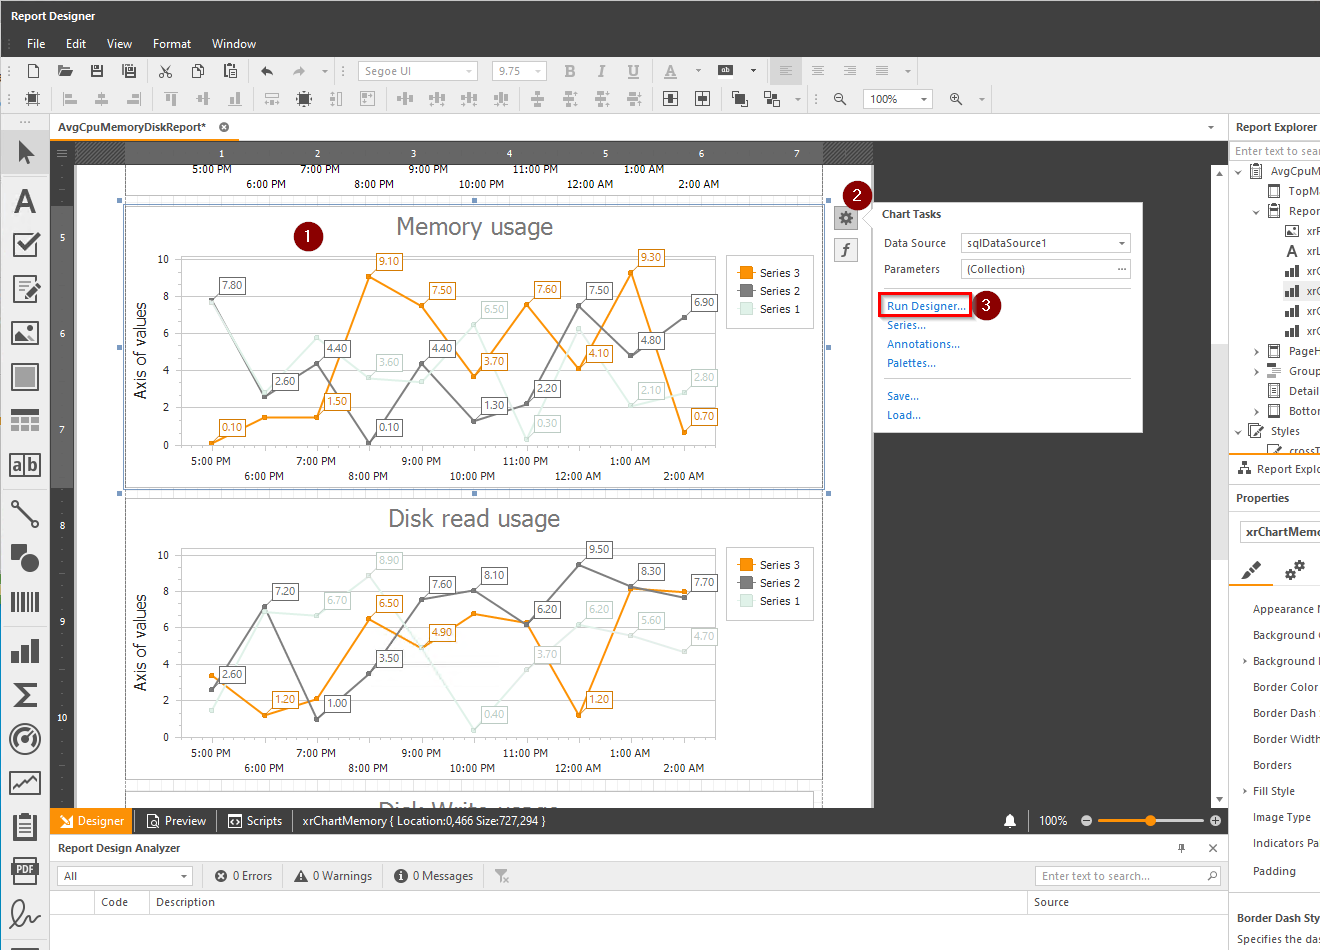
First, select the graph you want to change, then click on the settings button, and click on Run designer:
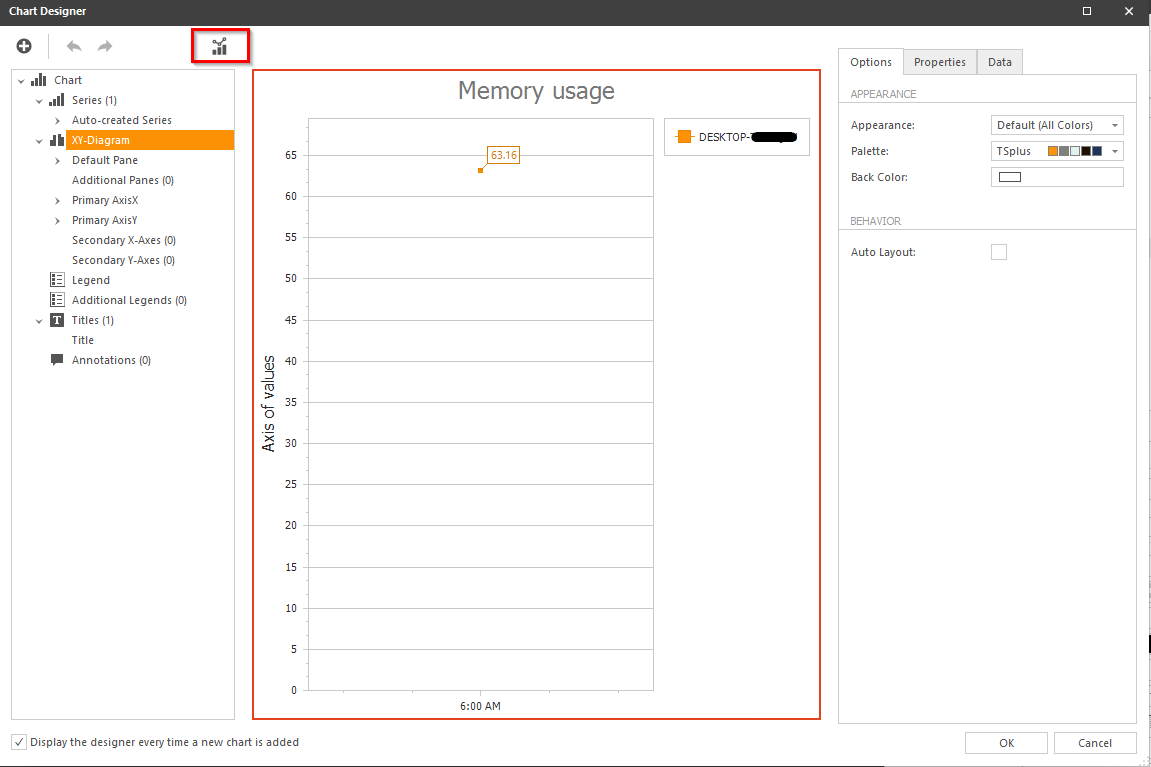
Then click on the “Change type” button:
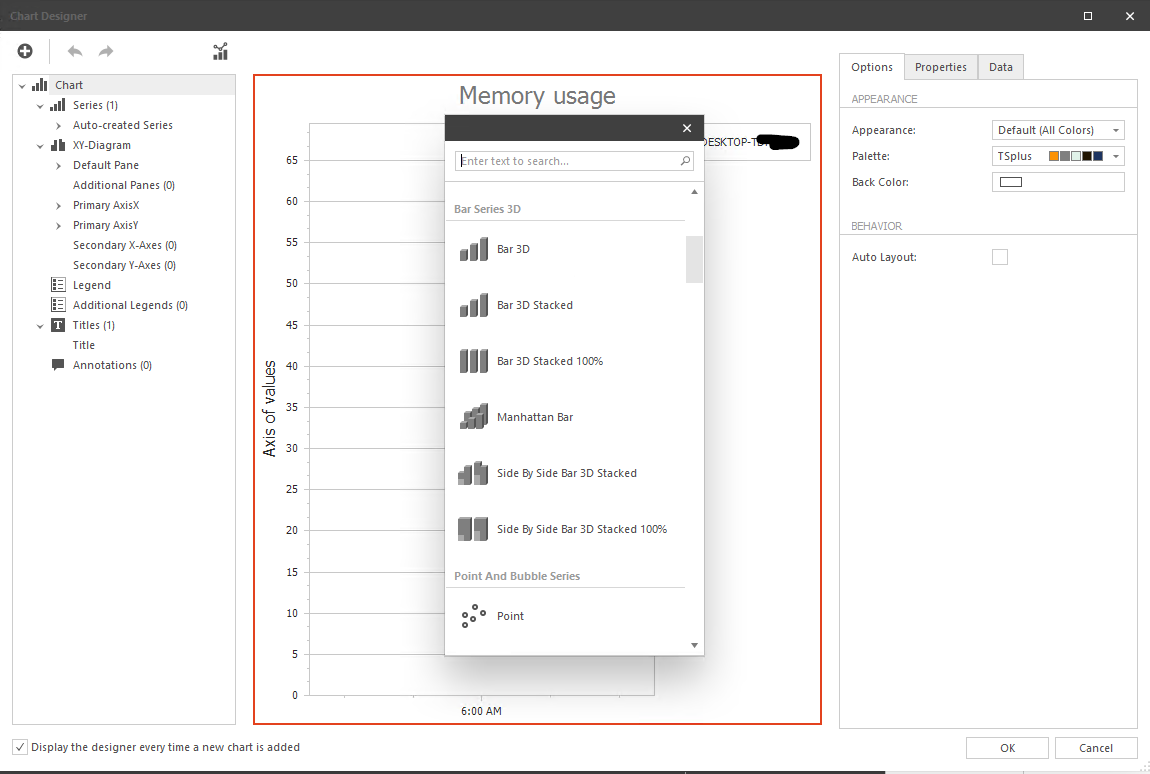
Choose the new type:
Click on OK, and look at the modifications applied:
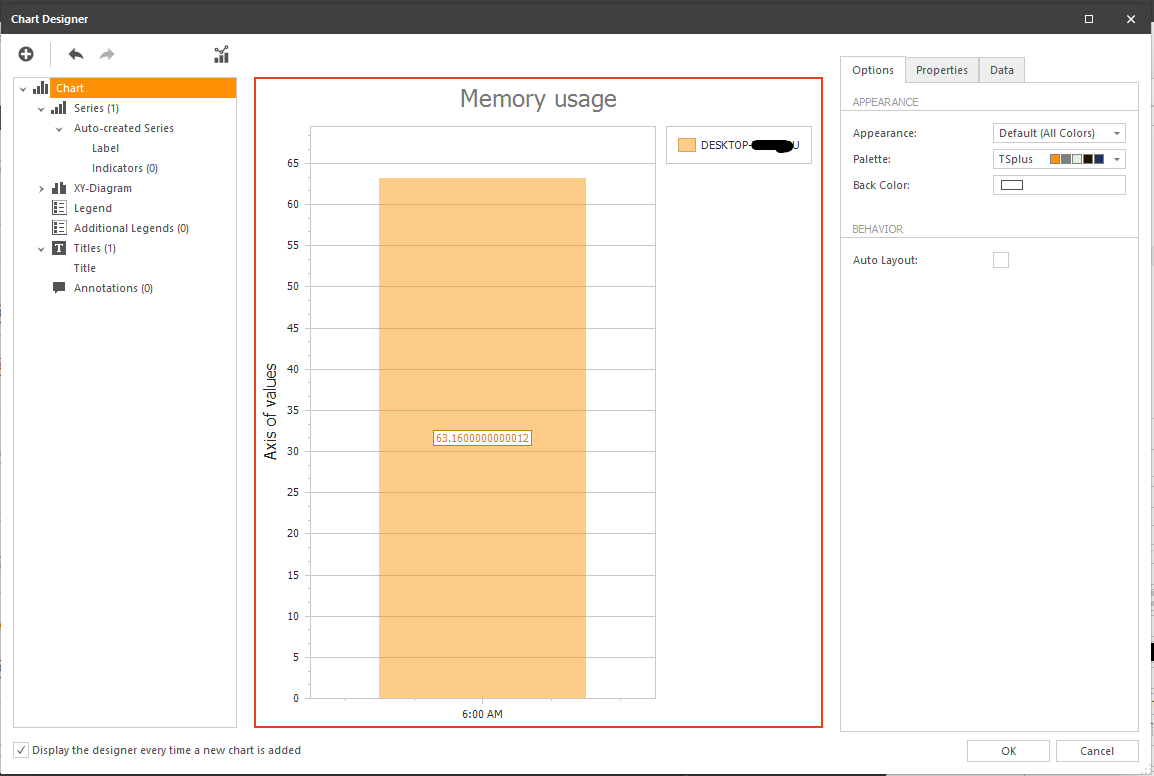
You also can, in this form, customize graph content (title, legend, annotations etc.)
Need help with this topic?
The TSplus Türkiye team can help you validate the configuration before production rollout.